Download Φ License Φ Forum Φ Team Φ Home
The query language of ConceptBase allows to transform answers into multiple external formats such as XML. Another example is the DOT format of Graphviz. Graphviz is a powerful set of tools to lay out directed and undirected graphs. Since ConceptBase manages models that can be visualized as graphs, an export interface to Graphviz is a natural option. Indeed, the answer transformation capabilities of ConceptBase are well-suited to do the job.

The first example is an Entity-Relationship Diagram (ERD).
EntityType Staff with
  attr name: String; hired: Date; salary: Integer
  attr,key staffno: Integer
end
EntityType Faculty with
  attr since: Date; post: String
end
EntityType Technician with
  attr since: Date; post: String
end
EntityType Student with
  attr since: Date
  attr,key studentid: Integer
end
EntityType University with
  attr, key name: String; location: String
end
EntityType Course with
  attr,key courseno: Integer; semester: String
  attr title: String
end
RelationshipType employs with
  role,"0..n" employee: Staff
  role,"1..1" employer: University
end
IsaType ISA_1 with
  sub sub1: Faculty;
      sub2: Technician
  super super1: Staff
end
RelationshipType teaches with
  role,"1..1" teacher: Faculty
  role subject: Course
end
EntityRelationshipType attends with
  role stud: Student; course: Course
  attr quota: Integer
end
Domain Date end
Domain String end
Domain Integer end
Domain Real end
UniversityModel in ERDModel with
  contains
    e1: Staff; e2: Faculty; e3: Technician;
    e4: Student; e5: University; e6: Course;
    e7: employs; e8: teaches; e9: attends;
    e10: ISA_1
end
The transformation of the Telos code (left) to the graphs (right) is performed by a collection of queries that classify the model elements into Graphviz node/link types and then formats the output according to the DOT language of Graphviz. It is well possible to expose certain nodes or links depending on their characteristics. For example, key attributes of entity types are displayed by ellipses with double lines and relationship types with attributes are displayed as diamonds with squared corners.
The second example is a Petri Net model for Dutch traffic lights.

red1 in Place with sendsToken t1: rg1 end
yellow1 in Place with sendsToken t1: yr1 end
green1 in Place with sendsToken t1: gy1 end
safe1 in Place with sendsToken t1: rg1 end
yr1 in Transition with
  producesToken
    p1: red1; p2: safe2
end
rg1 in Transition with producesToken p1: green1 end
gy1 in Transition with producesToken p1: yellow1 end
red2 in Place with sendsToken t1: rg2 end
yellow2 in Place with sendsToken t1: yr2 end
green2 in Place with sendsToken t1: gy2 end
safe2 in Place with sendsToken t1: rg2 end
yr2 in Transition with
  producesToken
    p1: red2; p2: safe1
end
rg2 in Transition with producesToken p1: green2 end
gy2 in Transition with
  producesToken  p1: yellow2 end
TrafficLights in PNModel with
  contains
   e1: red1; e2: yellow1; e3: green1;
   e4: safe1; e5: red2; e6: yellow2;
   e7: green2; e8: safe2; e9: yr1;
   e10: rg1; e11: gy1; e12: yr2;
   e13: rg2; e14: gy2
end
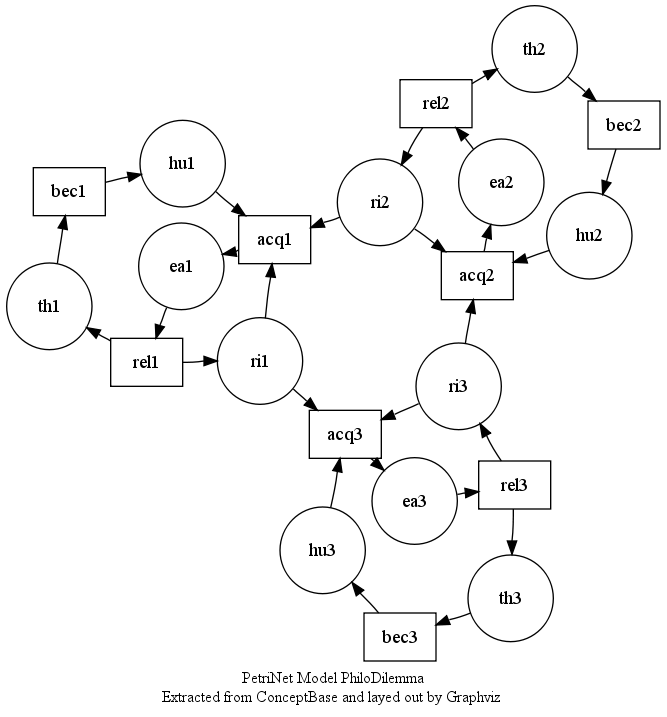
The Petri Net models the coordination of the two traffic lights of a road crossing. Places (i.e. states) are denoted by circles and transitions between states are denoted by boxes. The Telos model above is just listing the places and transitions together with their links (sendsToken, producesToken).The Graphviz layout (by neato) is perfectly symmetric in this case (and certain other other cases). Indeed, the two traffic lights are following the same scheme. Compare this layout to the man-made layout from here. The source code of the transformation routine is available here.
http://conceptbase.cc -- Contact: M. Jeusfeld, Tilburg University, Postbus 90153, 5000 LE Tilburg, The Netherlands -- 18-Dec-2012